There has been massive growth in the e-commerce industry recently, especially after the COVID-19 pandemic. However to maintain this growth we need to track the performance of different strategies we used to know whether it was successful or needed to be improved.
Simply working on different strategies by peeping at other businesses’ strategies without tracking where your business stands don’t make any sense.
To measure the performance there are various analytics tools and metrics that need to be understood especially when it comes to e-commerce business.
Let’s first understand what metrics are, key performance indicators the different types of metrics before diving into how to measure
What are metrics?
Metrics are the numerical results that show the value of the performance of the business.
What are Key Performance Indicators?
Key performance indicators are the measures that show how well our strategies performed during a period.
What are different metrics and how to measure them?
Impression
Impression indicates the number of times your landing page whether a paid campaign, organic search result, or social media post was visible to the audience. The impression doesn’t indicate the number of clicks your landing page has because even if your landing page was visible to the audience it’s not necessary for it will get clicks. Impression shows you how frequently your Google ads, Facebook ads, Instagram ads, and organic search results are shown to the audiences.
Click-through-rate
Click-through rates show the total number of clicks the landing page URL got.
Conversion Rate
It shows the total number of traffic made conversions from different marketing channels such as SEO, E-Mail, PPC and Social media.
Bounce Rate
Bounce rate is the measure that shows how many per cent of people left your site without doing any activity. It might be the case that the site’s website speed is slow, the website design is not good enough degrading the user experience, technical glitches in the website and many more. It’s important to track the bounce rate so keep it low
Organic Acquisition Traffic
The number of traffic reached to your website organically. It shows SEO performance results.
Customer Acquisition Cost
It is one of the most important parameters to measure the total cost you incurred for various marketing campaigns to attract a new customer. It should be less than AOV (Average Order Value). If it is more your marketing strategies need to be changed to cost > revenue.
It is calculated by dividing the Customer Acquisition Cost by the number of new customers gained.
Shopping Cart Abandoned Rate
It indicates the number of users who added the product to the cart but didn’t make any conversion. Analysing the cart abandoned rate triggers us to work and watch if there is any technical gap in the checkout process.
Checkout Abandoned Rate
It’s a bit different from the shopping cart abandon rate as the Check Abandoned rate shows the number of users who stopped making the payment procedure just before the end steps. It’s very crucial to know the reasons behind it as the conversion was just going to happen but didn’t happen. The reasons might be the call-to-action button didn’t work or the payment procedure stopped working in the middle forcing the user to back out.
Average Order Value (AOV)
AOV shows the average price the customer pays for the product per transaction. It indicates how much a customer spends on the product which should and must be higher than the Customer Acquisition Cost to have profits.
To increase AOV one must focus on increasing the up-selling and cross-selling marketing and loyalty programs
Customer Retention Rate
The number of customers returning to your website by being a loyal customer. A higher Customer retention rate indicates better customer service. To calculate the Customer retention rate, new customers should be subtracted from the total number of customers.
Lifetime Value (LTV)
LTV shows the amount one customer spends over a tenure of a particular period. It shows the brand loyalty of the customers which is important for the long-term goals.
Repeat Customer Rate
It shows how many per cent of customers made multiple purchases from the brand. Again it shows your brand credibility, dependability, customer loyalty and brand popularity.
Churn rate
The churn rate indicates the total number of customers who left your site. It is very important to know the possible reasons to work so that the churn rate will be as low as possible.
E-mail Sign up and Subscription rate
Subscription rate shows the new number of customers subscribed to the brand account leading to a successful e-marketing campaign.
Program participation rate
It indicates the number of customers participating in the different programs such as customer loyalty programs. The higher number of customers participating in the programs is likely to have an impact on other metrics as well such as CRR and LTV.
Net Promoter Score
It shows how many customers contributed to promoting the product and business overall in the form of reviews, testimonials, and posts, that encouraged other customers to visit your website. It segments the customers into different groups as Net Promoters, Neutral and Distractors so that you can highlight and work on improving the negative experience that users had.
Refund Rate
The refund rate shows the number of refunds a business has given in the period.
How to measure the performance?
Now that we are familiar with the metrics let’s understand how to measure and track them:
Set a SMART long-term and short-term goal.
SMART stands for Scalable, Measurable, Achievable, Relevant to your business and Time-bound.
Setting SMART long-term and short-term goals enables you to be on track without getting distracted. One just can’t focus on setting a short-term goal by long-term progress. Short term might be helpful to track the current progress and growth but long-term goals are useful to analyse “development” and how far the business has reached.
Set a clear short-term KPI and long-term KPI.
The metrics should be bifurcated based on the short-term and long-term business goals and set as a KPI to track the progress made by the business. Short-term KPI might be total impression, and click-through rates meanwhile the long-term might be customer retention rate and customer Lifetime Value Rate.
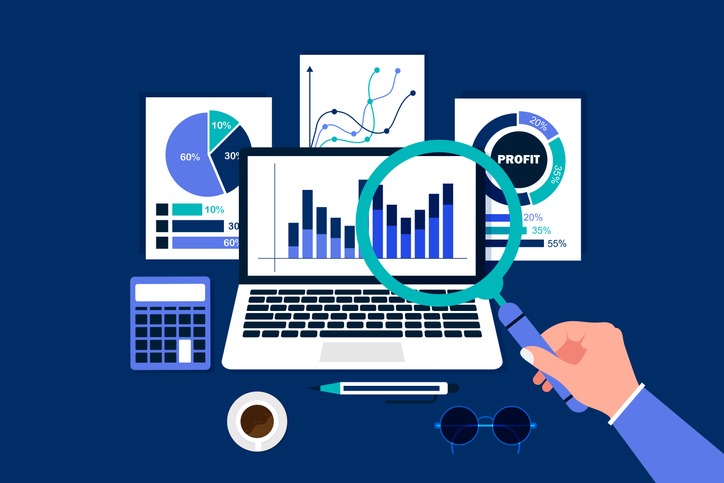
Data visualisation
Just having data is not important but to be able to understand is very important. Data is only useful when it is understood and analysed to further make changes and improvements that are necessary for the business otherwise it’s just a piece of information.
Set a realistic and achievable benchmark for the KPI
By understanding your current business condition and position, set a realistic and achievable benchmark to track the KPI.
Track the set KPI
Once the KPI is set, track the KPI to watch the frequent changes to analyse whether the changes are good for the business, and if not what are the loopholes that are affecting the business for further planning and strategies can be made.
Create an e-commerce dashboard
Creating an e-commerce dashboard will help track the results without much confusion.
Measures to improve the performance:
- Focus on the key marketing campaigns that are performing well.
- Improve E-commerce SEO to attain long-term goals.
- Improve the technicalities of the Call-to-action button and payment procedure to decrease cart abondant and check-out abondant rates.
- Create a strong loyal customer base through customer loyalty programs that can improve your Customer Retention Rate and Customer Lifetime Value and decrease the Churn Rate.
- Enable A/B testing to improve the functionality of the website.
- Work on Conversion Rate Optimisation and sales funnel to reduce the Customer Acquisition Cost and increase Average Order Value.
- Constantly work to increase user experience to improve the user engagement rate and decrease the bounce rate.
Conclusion
To analyse the e-commerce business performance first you must know your business requirements so that you can set relevant KPIs accordingly while analysing it regularly to develop a better version of the e-commerce business.

Pradeep Jade is a seasoned digital marketing consultant with over 20 years of experience across the market. He has helped businesses unlock sustainable growth in an ever-changing digital sphere. He is known for blending strategic insight with cutting-edge tools and technologies. He uses his vast experience to design result-driven marketing solutions that accelerate brand visibility, lead generation, and revenue growth. Book a free consultation with him to explore how you can take your business from 2X to 10X.